Feature
Metrics App
Get an overview of your key performance indicators on a practical, clear platform. The Metrics App from ownCloud enables the targeted collection of key performance indicators, providing information for reportings.
Community Edition
Standard Edition
Enterprise Edition
ownCloud.online Edition
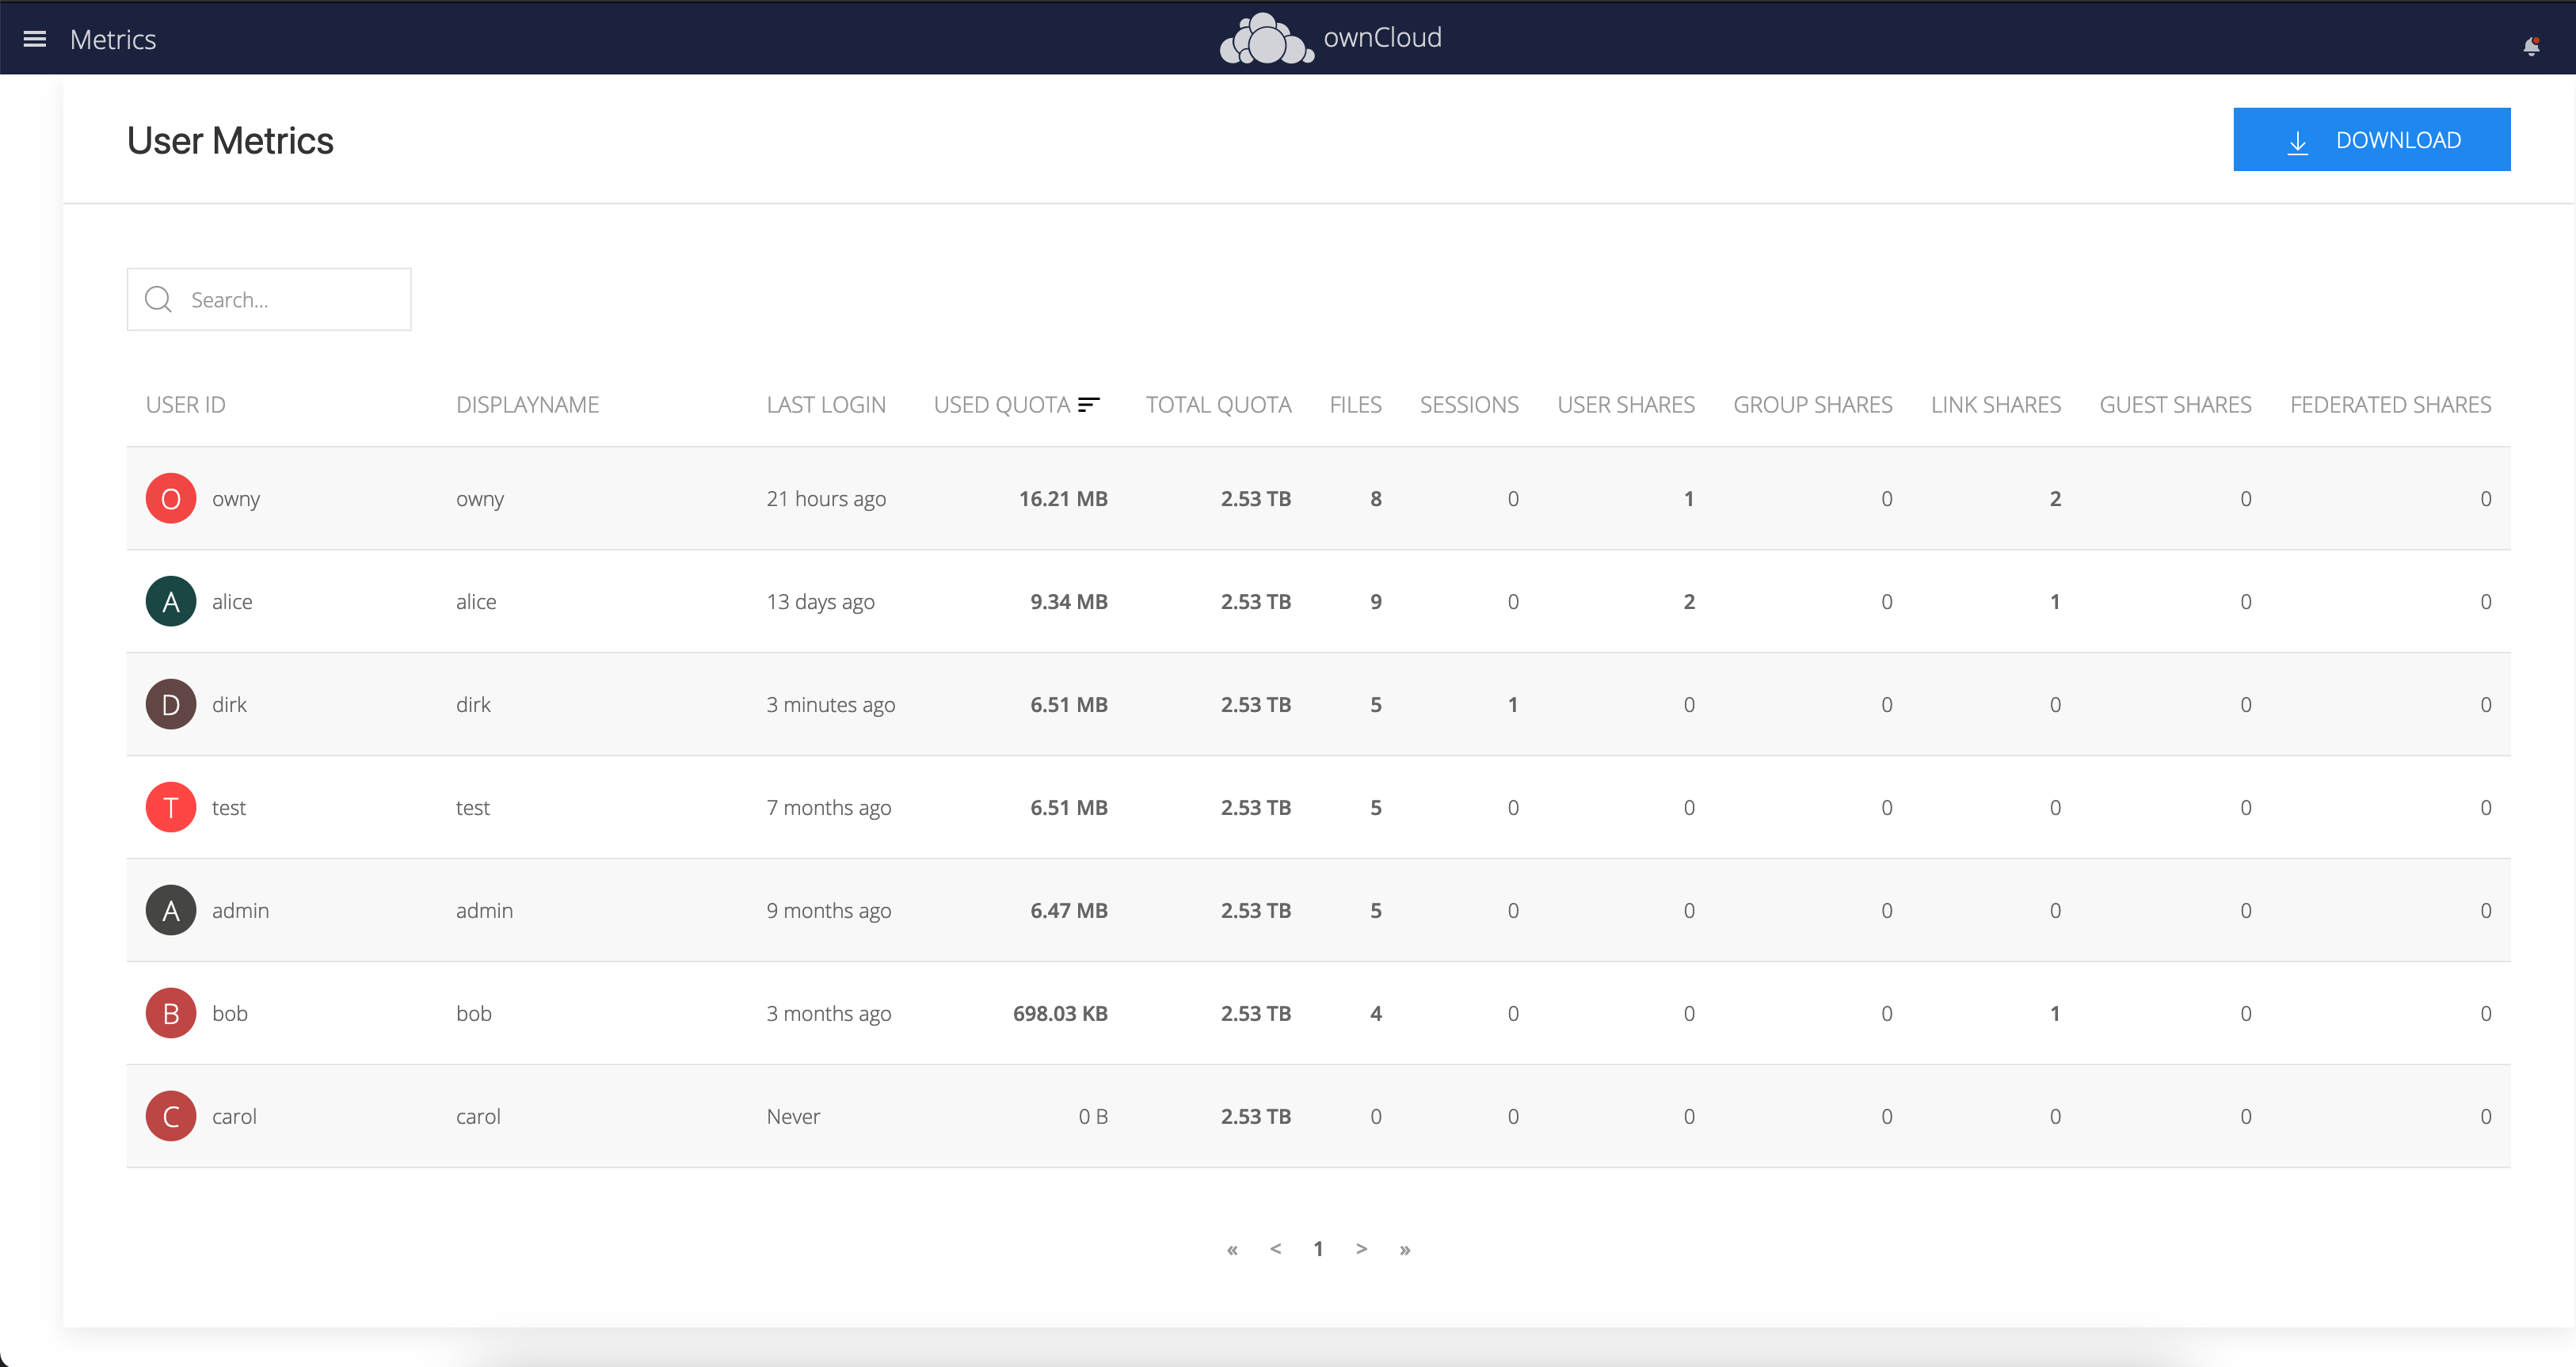
The Metrics App provides an API for reporting snapshots of quantitative data about users, shares and quota usage in the JSON format. It also provides a dashboard for reviewing real-time data and the option to download real-time data in the CSV format.
As an important fact, only real-time data is retrieved via the secure API, historical or personal data is not collected. This can be done either manually, or automatically in regular intervals to accommodate tools like Splunk, the ELK stack and Prometheus/Grafana that can then aggregate the data over time and make it useful for various statistical analyses and visualization. This way, no third party is involved in analyzing your data, which can be done completely on-premises.

The App provides two kinds of data: System data and per-user data.
System data includes information about the storage available, used and free, and the number of files. It lists the number of users registered, active and logged in. It also includes the number of user shares, group shares, guest shares, link shares and federated shares.
Per-user data lists the last login, the number of active sessions, the quota limit and usage, the number of files and the number of shares the user has created, itemized into user shares, group shares, guest shares, link shares and federated shares.
The report in JSON format can be filtered down to only include data that is needed.

Ready to get started?
Learn more about Metrics App
Blog
